Getting Started with LLDB or: How I Learned to Stop Worrying and Post an Unpublished Magazine Article
Once upon a time, there was a developer and IT-focused Mac magazine known as MacTech. I was first introduced to it while working for an Apple-focused professional services company called Macprofessionals back in 2010. I remember the first time I picked one up; I was immediately struck by how much it felt like it was made just for me, the kind of super-niche thing that you don’t expect to ever see in such an “official” form. Needless to say, I devoured many issues. Years later, I ended up working with the Executive Editor of MacTech at Duo Labs, (the research arm of Duo Security, now part of Cisco). After a couple years of working together, Ed asked if I’d have any interest in writing an article for a reboot of the magazine, since we were both Mac nerds. I was honored and immediately jumped at the opportunity. Unfortunately, though, the magazine was never rebooted, so the article I wrote has been sitting dormant on my hard drive for some years. But, while on a run the other day, I was thinking about wanting to write more on my blog, and I remembered this. So, here it is, in all its messy, human glory.
Getting Started with LLDB
The Low Level Debugger, or LLDB, is a C, C++, and Objective-C debugger that’s part of the larger Low Level Virtual Machine (LLVM) compiler infrastructure. It, (along with most of LLVM), was originally developed by Chris Lattner as part of his graduate work at The University of Illinois at Urbana-Champaign, and was later adopted by Apple to replace GCC and GDB as their compiler and debugging infrastructure, respectively. In this article, I’ll explain what debuggers are, what they’re good for, and how LLDB differs from GDB and other debuggers. Then, I’ll show you how to get set up with LLDB on your own Mac. Finally, I’ll demonstrate how to debug your own programs with LLDB on macOS.
What’s a Debugger?
In its simplest form, a debugger is a program designed to debug other programs. Many Integrated Development Environments (IDEs) include the ability to debug programs as you develop them. These are sometimes referred to as source-level debuggers, as they’re able to halt if an exception or fault is encountered, and show the source code line where it occurred. Low-level debuggers, on the other hand, show where these faults occur in the program’s disassembly. LLDB is both a source-level and low-level debugger. When the source code is available, for example when debugging your own programs in Xcode, LLDB will show in the original source code where the exception occurred, but it also supports debugging other programs for which no source-code is available, for which it displays the disassembly. In addition to LLDB, some other popular debuggers are listed below:
JavaScript debuggers as used in web browsers are also very common, like those used in Chrome, Firefox, and WebKit.
Why You Need a Debugger
So, why do you need a debugger, anyway? After all, isn’t the easiest way to figure out what a “thing” is is by simply printing it out? Perhaps, but this has some drawbacks. First and foremost, littering your code with printf statements can quickly lead to less readable and longer code. Secondly, it’s easy to forget to remove printf statements from your code before publishing it. Many programmers have been guilty of accidently pushing an embarassing line of code looking something like the following:
printf("HERE IS THE VALUE: %s\n", variable);`
Also, what if the value you’re printing contains sensitive information? Recently, companies like Twitter and GitHub have had to release product security advisories about printing sensitive information in internal logs, such as passwords. It stands to reason that if a logging system is capturing stdout and/or stderr from a program that it’s possible that the output from print statements can end up in places where it shouldn’t be. What if we could make it harder to make this type of mistake in the first place, though? Fortunately, we can: by using a debugger. And, if you’re using macOS, (which, presumably you are if you’re reading this!), then lldb is a fine choice.
LLDB vs. GDB
LLDB and GDB are both excellent debuggers, but they do have some differences. Longtime Mac developers will remember when GDB, GCC, and the rest of the GNU compiler infrastructure were included with the Developer Tools on Mac OS X, but Apple has since migrated to the LLVM compiler infrastructure, which it largely maintains. Also, many C programmers and *nix users may already be familiar with GDB, but making the switch to LLDB, (or at least becoming familiar with it), isn’t that hard, especially considering that the LLDB developers maintain an LLDB to GDB command map.
Getting Started With LLDB
The Setup
The easiest way to get started with LLDB is to install Xcode. Alternatively, if you prefer not to install the entire Xcode IDE, you can just install the Xcode Command-Line Tools. Once you’ve done this, you should be able to launch your Terminal emulator of choice, (e.g., Terminal.app), and type lldb to start the LLDB interactive debugger.
Debugging Your Own Programs
Arguably, the easiest way to get started with LLDB is just by using Xcode. By default, if your program faults, Xcode will switch to the Debug navigator and start a Debug Session with LLDB, showing you in your code where the problem lies. Now, if you’re anything like me, then you may find this very daunting at first. Not to worry though, we’ll walk through a typical example of a fault being encountered and then work our way through how to figure out what went wrong.
For instance, consider the following contrived example. Here we have a new Xcode project where I’ve intentionally introduced a bug that will cause the application to fault:
//
//  ViewController.m
//  LLDB Test
//
//  Created by James Barclay on 5/19/19.
//

#import "ViewController.h"

@implementation ViewController

- (void)viewDidLoad {
    [super viewDidLoad];

    int *x = NULL;
    *x = 1;  // This will crash.
}

@end
If you build and run this project in Xcode, the application will fault and start an interactive debugging session within Xcode.
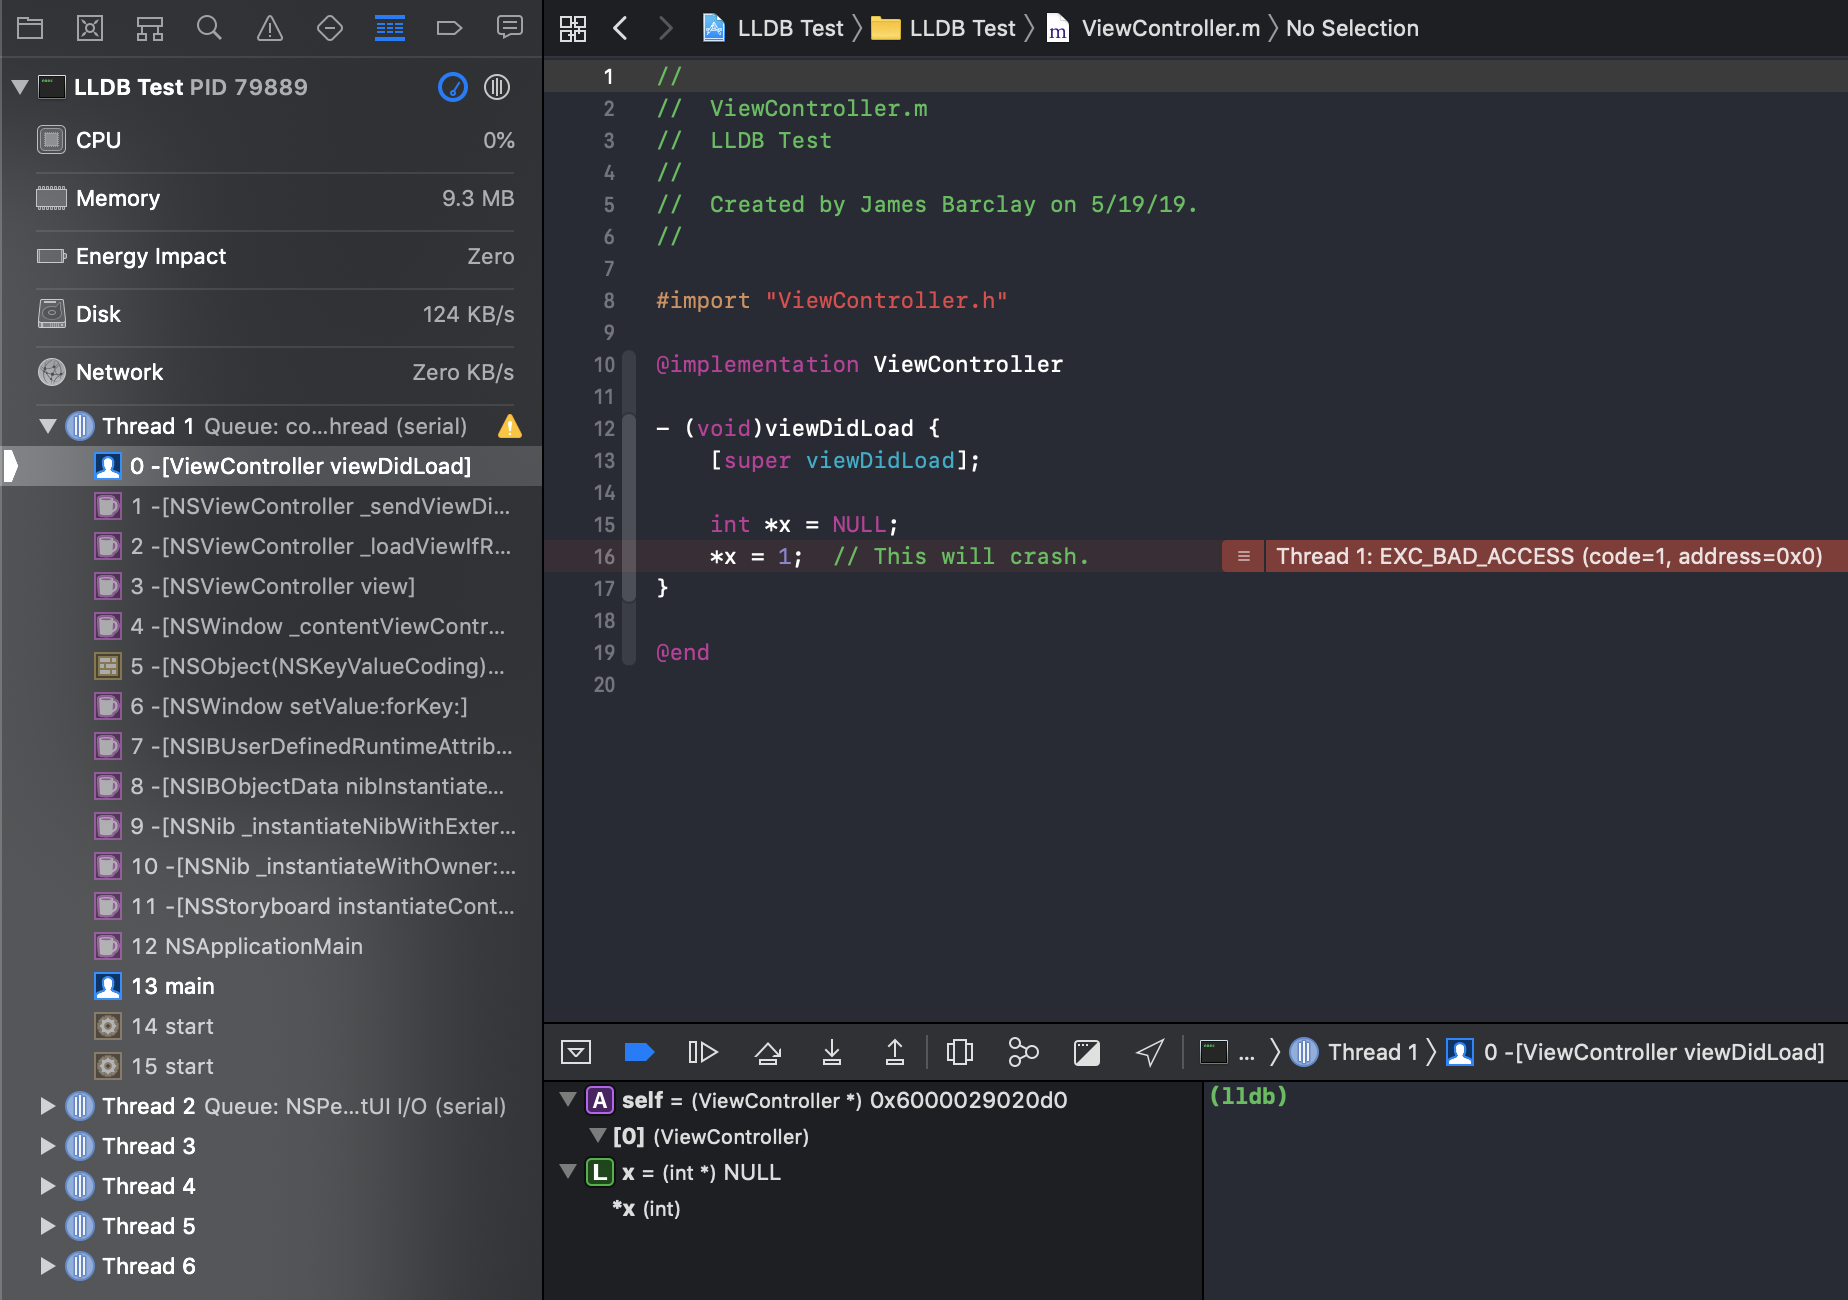
When the program crashes, Xcode will switch to the Debug navigator and you’ll be able to inspect processes, threads, and variables, as well as enter commands in the debug console, which is located at the bottom-right of the Debug area by default. Xcode will also unwind the stack and present it to you in the process view pane on the left.
Now that the debugging session is active in Xcode, we can use the tools made available to us to try to figure out the source of our bug. We can, for instance, type commands into the debug console, such as p x to print out the result of evaluating the x variable in the current frame. We can also step through the the program’s flow with the following commands:
s   // thread step-in (Do a source-level step in the current thread)
si  // thread step-inst (Do an instruction-level step in the current thread)
n   // thread step-over (Do a source-level step over in the current thread)
ni  // thread step-over-inst (Do an instruction-level step in the current thread)
f   // thread step-out (Step out of the current frame)
The primary thing to remember when stepping through a program’s flow with the above commands is that s and si will step into subroutines, while n and ni will “step over” (i.e., skip) them. Thus, if you suspect your problem lies within a subroutine, you may want to use s or si.
To continue execution of the program’s flow, type continue, (or just c for short).
Some of the other most commonly used LLDB commands are p and po, which allow you to examine values of different types of variables. Combining these with the process control commands mentioned above allow you to step through your program line-by-line and evaluate the state of variables over time, which is invaluable in determining the cause of bugs, (or just learning more about how your program works!). Plus, this way you don’t need to litter your source code with unnecessary printf or NSLog() statements! The biggest difference to remember between p and po is that po (print object) is meant to print the value of objects. It does this by sending the debugDescription method to the object if it responds to that selector, and the description message if not, (then displays the output). In the case of CoreFoundation types, it calls the CFShow() function and returns the output. p is faster and less complex than po, so unless the variable you’re inspecting is an object, (e.g., inherits from NSObject), or CoreFoundation type, use p.
In this case, the bug we’ve intentionally introduced is a NULL pointer dereference, which Xcode makes rather clear by pointing to the offending line with the error message Thread 1: EXC_BAD_ACCESS (code=1, address=0x0).

Setting Breakpoints in Xcode
What if you don’t want your program to stop just when it crashes or an exception is raised? What if instead, you could choose when your program stops, and then have full control over how it executes? Fortunately, you can do just that, and the even better news is that it’s pretty darn easy.
A breakpoint is an intentional stopping point in a program. Breakpoints are extremely useful for debugging purposes, as you can set them on specific source lines, function calls, or selectors. In Xcode, you can also set a breakpoint simply by clicking next to the source line where you want the breakpoint to occur, as shown below:
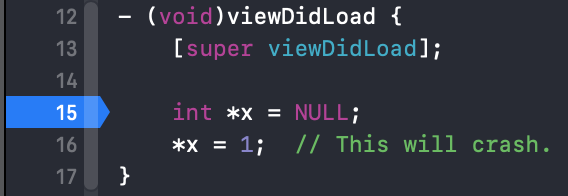
The above breakpoint will cause the program to pause on line 15, just as the x variable is being allocated and initialized to NULL.
If we step through the program line-by-line, we’ll eventually get to the offending line that causes the program to crash.
Setting Conditional Breakpoints in Xcode
Sometimes you only want to pause program execution under certain conditions. For example, let’s say you want a breakpoint to fire only if the value of an int variable is 42. Consider the following example:
for (int i = 0; i < 50; i++) {
    NSLog(@"i is: %d", i);
}
To pause the program when the value of i is equal to 42, set a breakpoint at the line containing the NSLog() statement and control-click on the highlighted breakpoint in Xcode. From there, select “Edit Breakpoint” and enter the following expression in the “Condition” text field.
i == 42
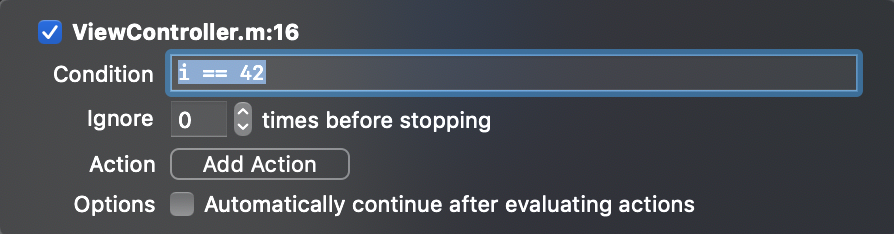
Here’s another example showing an Objecive-C expression that breaks when an NSString object that’s accessed from an NSArray object equals the string “three.”
NSArray *arr = @[@"one", @"two", @"three"];
for (NSString *str in arr) {
    NSLog(@"str is: %@", str);
}
(BOOL)[[NSString stringWithString:str] isEqualToString:@"three"]
Each of these are contrived examples, but the possibilities are nearly limitless! Imagine conditionally setting a breakpoint only if a variable is nil when it’s not expected to be, or only when you’re in a certain physical location, (e.g., by leveraging CoreLocation).
Using the Debugger In-Place of Print Statements
Remember what I said about using a debugger to print values instead of littering your code with printf statements? Xcode also makes this rather easy. Simply click the source line where you’d normally insert your printf, NSLog() or similar statement, and click “Edit Breakpoint…” Then, click the “Add Action” button, and choose “Debugger Command” from the Action drop-down. Then, simply type po <name_of_variable> in the text field. If you also check the box to “Automatically continue after evaluating actions,” your program will continue running without pausing. Now you can see the value the variable without modifying your source code! Additionally, any valid LLDB command can be entered there, too, so you’re not limited to just p and po.
Changing Program State with LLDB
It’s also possible to change program state from LLDB. Let’s say the value of an NSInteger variable is 3, but you want to change it to 42. Consider the following example.
NSInteger i = 3;
NSLog(@"i is: %ld", (long)i);
// Set breakpoint here.
NSLog(@"i is: %ld", (long)i);
To change the value of the NSInteger variable to 42, set a breakpoint on the line between the two NSLog() statements. Then, in the debug console type the following, then hit return:
expr -- i = 42
Doing the above will modify the NSInteger variable named i to contain the value 42.
2019-05-21 19:31:38.536406-0400 LLDB Test[46709:3778735] i is: 3
(lldb) expr -- i = 42
(NSInteger) $0 = 42
(lldb) c
Process 46709 resuming
Using LLDB as a Standalone Debugger From the CLI
If you’d rather not use Xcode, or if the program you’re writing doesn’t lend itself to using a fully featured IDE, then you can also use lldb from the command-line. To do so, launch your favorite Terminal emulator and type lldb, then hit return. This will start an LLDB interactive shell.
$ lldb
(lldb)
To see a list of common commands, type help.
(lldb) help
Debugger commands:
  apropos           -- List debugger commands related to a word or subject.
  breakpoint        -- Commands for operating on breakpoints (see 'help b' for shorthand.)
  bugreport         -- Commands for creating domain-specific bug reports.
  command           -- Commands for managing custom LLDB commands.
  disassemble       -- Disassemble specified instructions in the current target.  Defaults to the
                       current function for the current thread and stack frame.
  expression        -- Evaluate an expression on the current thread.  Displays any returned value with
                       LLDB's default formatting.
  frame             -- Commands for selecting and examing the current thread's stack frames.
  gdb-remote        -- Connect to a process via remote GDB server.  If no host is specifed, localhost
                       is assumed.
  gui               -- Switch into the curses based GUI mode.
  <snip>
Consider the following simple C program, which prints the numbers 1-5 separated by newlines. Let’s explore debugging this simple program from the CLI with LLDB.
#include <stdio.h>

int main(int argc, char *argv[])
{
    for (int i = 1; i < 6; i++) {
        printf("%d\n", i);
    }

    return 0;
}
Save this file as one_through_five.c, then compile it with make.
make one_through_five
To start the program with LLDB, type lldb one_through_five, then hit return. This will start an interactive LLDB prompt and automatically attach to the one_through_five program. You can also start LLDB first, then attach to your program and run it.
$ lldb
(lldb) file one_through_five
Current executable set to 'one_through_five' (x86_64).
(lldb) run
Setting Breakpoints in the LLDB Standalone Debugger
Just as you can set breakpoints in your code from Xcode, you can do so from the LLDB standalone debugger. Breakpoints can be set by name, selector, regex, line number, and more. For example, to set a breakpoint at the main function, type the following:
(lldb) breakpoint set --name main
Breakpoint 1: where = one_through_five`main, address = 0x0000000100000f40
The output shows that a breakpoint has been set on the main function at address 0x0000000100000f40. We can run the program with run, (or r for short), then step through its execution, (e.g., with s[tep], n[ext], c[ontinue], etc.).
(lldb) r
Process 65906 launched: '/Users/jbarclay/src/lldb_cli_example/one_through_five' (x86_64)
Process 65906 stopped
* thread #1, queue = 'com.apple.main-thread', stop reason = breakpoint 1.1
    frame #0: 0x0000000100000f40 one_through_five`main
one_through_five`main:
->  0x100000f40 <+0>: pushq  %rbp
    0x100000f41 <+1>: movq   %rsp, %rbp
    0x100000f44 <+4>: subq   $0x20, %rsp
    0x100000f48 <+8>: movl   $0x0, -0x4(%rbp)
Target 0: (one_through_five) stopped.
(lldb) s
Process 66462 stopped
* thread #1, queue = 'com.apple.main-thread', stop reason = instruction step into
    frame #0: 0x0000000100000f41 one_through_five`main + 1
one_through_five`main:
->  0x100000f41 <+1>:  movq   %rsp, %rbp
    0x100000f44 <+4>:  subq   $0x20, %rsp
    0x100000f48 <+8>:  movl   $0x0, -0x4(%rbp)
    0x100000f4f <+15>: movl   %edi, -0x8(%rbp)
Target 0: (one_through_five) stopped.
You may also notice that LLDB displays the program’s disassembly, rather than the source code. This is because, by default, when you compile a program with clang it doesn’t export debugging symbols. To ensure clang will export debugging symbols with your program, use the -g flag to Generate debug information.
clang -g -O0 one_through_five.c -o one_through_five
Compiling one_through_five.c as listed above will export debugging symbols, and create a new directory alongside the one_through_five executable named one_through_five.dSYM. Now, when you debug the program with LLDB you’ll see the full source code, rather than the disassembly. This also allows you to set breakpoints for specific lines in the file, which is not possible without the symbol table.
(lldb) breakpoint set --file one_through_five.c --line 6
Breakpoint 2: where = one_through_five`main + 39 at one_through_five.c:6:24, address = 0x0000000100000f67
(lldb) r
Process 68198 launched: '/Users/jbarclay/src/lldb_cli_example/one_through_five' (x86_64)
Process 68198 stopped
* thread #1, queue = 'com.apple.main-thread', stop reason = breakpoint 2.1
    frame #0: 0x0000000100000f67 one_through_five`main(argc=1, argv=0x00007ffeefbff300) at one_through_five.c:6:24
   3   	int main(int argc, char *argv[])
   4   	{
   5   	    for (int i = 1; i < 6; i++) {
-> 6   	        printf("%d\n", i);
   7   	    }
   8
   9   	    return 0;
Target 0: (one_through_five) stopped.
Conclusion
Hopefully, if you’ve read this far, you now have a better understanding of what LLDB is and how to use it to debug your own software. LLDB is an extremely powerful tool, and the possibilities for what you can do with it are nearly endless! Stay tuned for next time, as I’ll be covering more advanced LLDB topics.